The Power of Visualization in Mathematics
- bluemathlab
- Mar 13
- 2 min read

Mathematics is often seen as a subject filled with numbers, formulas, and abstract concepts. However, one of the most powerful tools for understanding mathematics is visualization. When students learn to see mathematical ideas through diagrams, graphs, and models, complex problems become easier to understand and solve.
Visualization transforms mathematics from a collection of symbols into meaningful patterns and relationships.
Why Visualization Matters in Mathematics
Visualization helps students move beyond memorization and develop deep conceptual understanding. When learners can picture a mathematical idea, they can analyze it more effectively and apply it in different situations.
Benefits of visualization include:
Better conceptual understanding
Faster problem-solving skills
Improved memory retention
Increased student engagement
Reduced math anxiety
For example, when students visualize geometric shapes or algebraic graphs, they can immediately understand relationships that might take several steps to explain through equations alone.
Visualization in Geometry
Geometry is one of the clearest examples of visualization in mathematics. Concepts like angles, triangles, circles, and volumes become easier when students use diagrams.
For instance, the famous relationship in a right-angled triangle can be visualized easily:
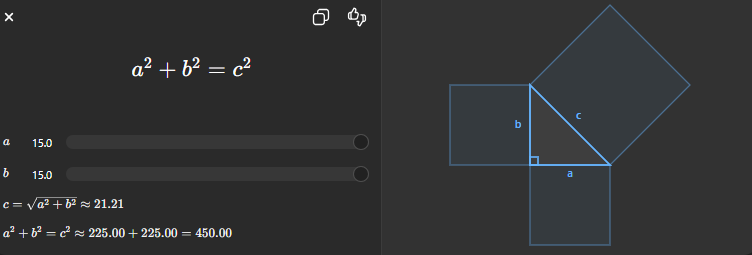
Seeing squares built on each side of the triangle helps students understand why this relationship works rather than simply memorizing the formula.
Visualization in Algebra
Many students struggle with algebra because they see it as abstract symbols. Visualization helps connect algebra with real patterns.
A simple example is the graph of a linear equation:
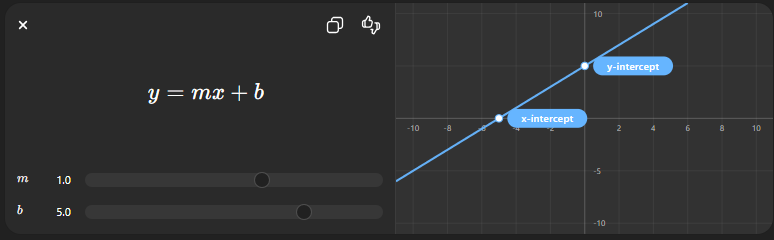
By plotting the equation on a graph, students can immediately see:
The slope (m) as the steepness of the line
The y-intercept (b) as where the line crosses the vertical axis
How changes in values affect the graph
This visual approach makes algebra much easier to understand.
Visualization in Trigonometry
Trigonometry relies heavily on visual thinking. The relationships between sine, cosine, and tangent become clearer when students study them using the unit circle or right-angled triangles.
Instead of memorizing formulas, visualizing angles and ratios allows students to understand how trigonometric functions behave.
Modern Tools for Mathematical Visualization
Today, technology has made mathematical visualization even more powerful. Tools such as graphing software, digital simulations, and interactive diagrams help students explore mathematical concepts dynamically.
Students can:
Rotate 3D shapes
Change graph parameters instantly
Explore geometric transformations
Visualize complex functions
These tools make learning mathematics more interactive and engaging.
How Teachers Can Use Visualization
Effective math teaching often combines explanation with visual representation. Teachers can improve student learning by using:
Graphs and coordinate planes
Geometric diagrams
Color-coded equations
Real-life visual examples
Digital graphing tools
Visualization encourages students to think mathematically instead of memorizing procedures.
Conclusion
Visualization is one of the most powerful strategies for mastering mathematics. When students learn to see mathematical ideas through graphs, diagrams, and models, complex concepts become clear and intuitive.
By integrating visualization into math education, teachers can help students develop stronger problem-solving skills, deeper understanding, and greater confidence in mathematics.
At Bluemathlab, we believe that mathematics becomes easier and more enjoyable when students learn to visualize the logic behind the numbers.


Comments